Image prompt
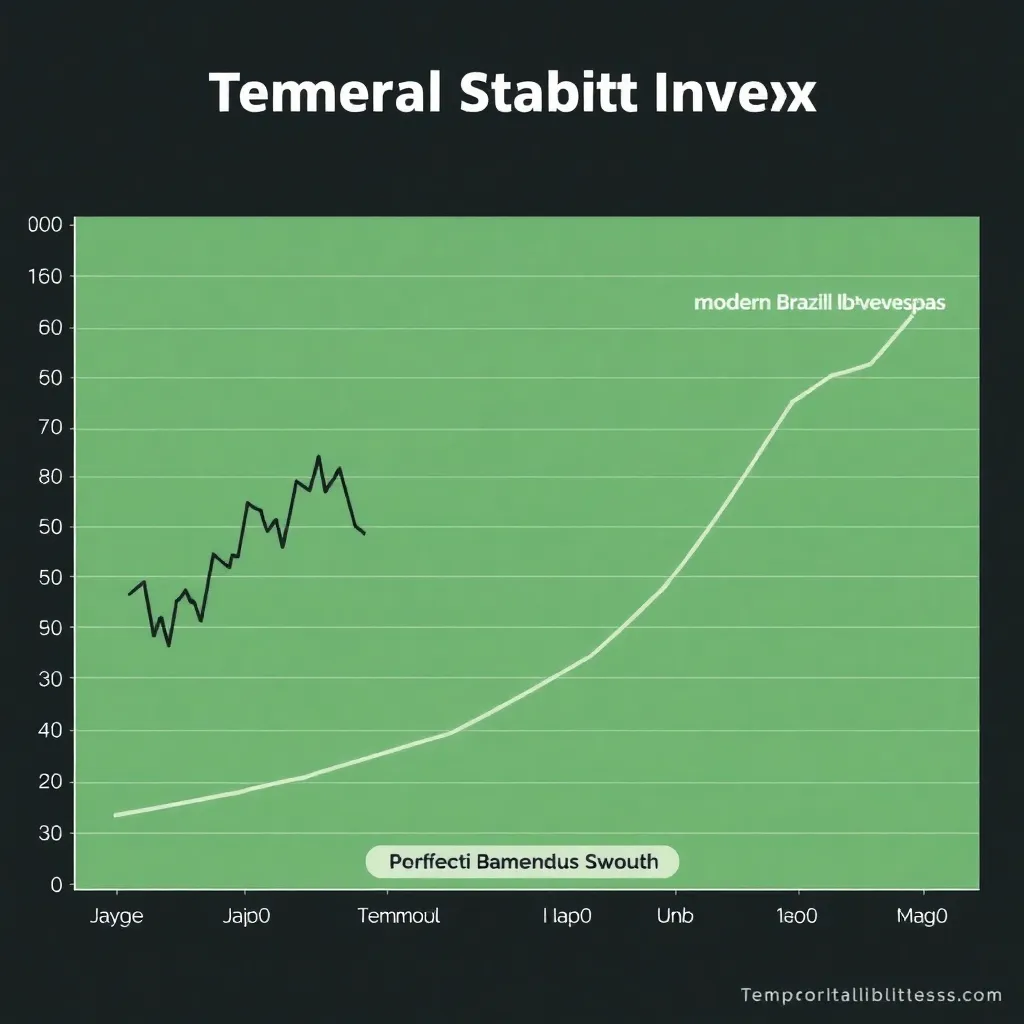
Chart comparing modern market volatility with Bamerindus stability.
A technical chart showing two lines: one jagged and volatile representing the modern Brazilian Ibovespa index, and one perfectly smooth, upward-sloping line representing Bamerindus Savings growth, labeled 'Temporal Stability Index'.